Texture Analysis SolutionsBrownie Freshness
- Objective measurement test method to clearly differentiate between fresh and stale bakery products
- Repeatable and useful comparison test method using a software-controlled texture analyzer
- Precision bend fixture to initially compress, then flex and potentially snap the product as a measurable indicator soft freshness to hard staleness
- Quantified hardness, cohesiveness and fracturability texture attributes correlated to sensory freshness
Situation
You can break a fudge brownie in your hands, and if you are expert, judge its texture in terms of hardness through the way it breaks. But how well can you judge freshness, sample after sample? Or whether a different formulation improves the product or its shelf life? Can you measure the end consumer’s texture preference? Ideally, you need to be able to place regular production line samples into a food texture analyzer and achieve accurate and repeatable results against clear criteria of quality.
Method

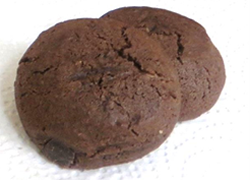
In this test example we compared fresh and stale samples of fudge brownies, in order to illustrate the detectable differences. Fresh sample brownies were taken from a sealed packet, and compared with brownies simply left out overnight.
A Food Technology Corporation TMS-Pro texture analyzer was used for the tests, with a 500 N intelligent loadcell and a lightweight three-point bend fixture. Each sample was placed centrally on the lower supports, under the upper anvil edge. The program moved the upper anvil down to meet the top of the sample, and then down a further 15 mm at a speed of 100mm/min. This was far enough to ensure a break. After each test, the TL-Pro software calculated the maximum force applied, and revealed the trace of force applied against displacement, from touch to break.
Results
The graphical representation from TL-Pro, of the test results for the four samples, is shown here (force applied, against cumulative displacement).

Two groups of traces are clearly distinguishable, showing that freshness (softness) is being detected in the test. There is greater variability in the stale samples than the fresh, and shorter intervals since unwrapping could be tested and still be distinguishable.
The same results with additional calculations are shown here. Hardness is the peak force applied before breaking.

- Average = arithmetic mean
- SD = standard deviation
- CV = coefficient of variation: (SD/Mean) x 100
Significance
From the results, standard deviation and coefficient of variation are both well within the accepted range for test method validation. As a test for freshness, this form of testing is both detailed and repeatable, with a high degree of accuracy. Data gathered in this way, from samples that have been subjectively judged to be desirable, can be used to create tolerance levels for instant pass/fail quality assessment. This method can also be used to assess rate of staleness over time, both after unwrapping, and after extended wrapped storage. Formulations with different amounts of preservatives can also be objectively compared, which is a vast improvement on purely subjective manual judgment.