Chewing Gum Bend Strength
Highlights
- Objective measurement process developed to enable the comparison of samples of varying formulations
- Repeatable and accurate test method using a software-controlled texture analyzer
- Precision bend flexture fixture to fold the stick-shaped product until fracture or failure
- Quantified fracturability texture correlated to user sensory perception when placing the gum into the mouth
Situation
 Large food processor was looking for a way to control the texture of two similar products with different recipes. Current methods involved simple sensory testing.
The two products were essentially the same, the difference being the flavor. The problem was that even though the process was the same, the final texture of each was different. The different flavoring ingredient was thought to be the cause. Because they did not have an objective way to measure the differences, there was no way to confirm this.
Method
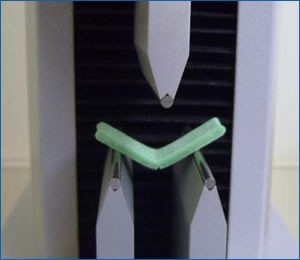
 It was determined that using the 3-point bend fixture for testing was going to give the best results. This basically replicates the treatment of the consumer when they put the gum in their mouth.
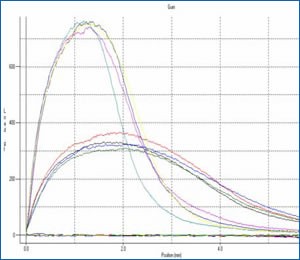
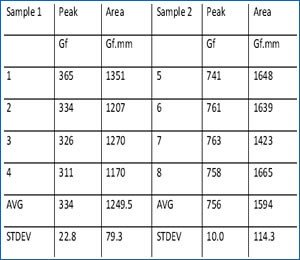
Each sample was deformed to the same displacement. At the end of each replication, calculations of the peak force and work (area under the curve) were done.
From these two measurements and the overall picture that the graph gave, we were able to show a significant difference in the two variants of the same product.
Significance and Benefits
 Allows processor to put objective numbers to their sensory data
- Software facilitates automatic statistical analysis and objective measurements
- Graphing function lets the user visually see where the two products are different
- Simple and quick test