Texture Analysis SolutionsPickled Gherkin Crunchiness
Highlights
- Objective measurement of the physical properties of the pickle correlated to sensory crunch
- Repeatable test method for comparative results using a software-controlled texture analyzer
- Precision notched blade fixture to consistently slice through the sample completely replicating bite
- Quantified data to calculate a representative crunch factor from measured hardness and fracturability texture
Situation
 If you want to know the crunchiness of a pickle: bite it. Expert testers are relied on throughout the food industry, but can you objectively quantify crunchiness, and use this to assure product consistency, or improve manufacture? Different preparations can also be compared for measurable degrees of crunchiness.
Method
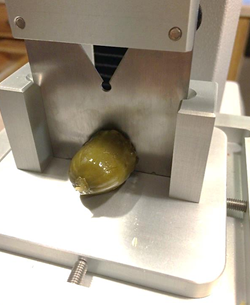 A Food Technology Corporation (FTC) TMS-Pro texture analyzer was used, fitted with a 500 N intelligent loadcell and a TMS lightweight blade set. This fixture features two blades with four different cutting edges. The large v-notched blade was chosen as being most suitable for the product being tested.
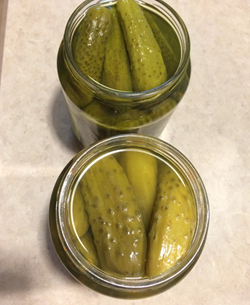
The TL-Pro test program was written to slice through each sample pickled gherkin (dill cucumber) at a speed of 250 mm/min to a distance far enough to cut it through completely. Due to the variable nature of the product, several cuts were made in each pickle so as to gain a better overall picture of the product. On completion of the test, the TL Pro graphical data and calculations on the sample were examined.
Results
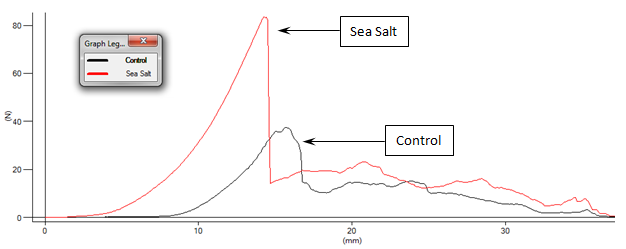
The two traces shown are a representative sample from the control group and the "crunchiest" sample from the sea salt group.
The same results with additional calculations are shown here.
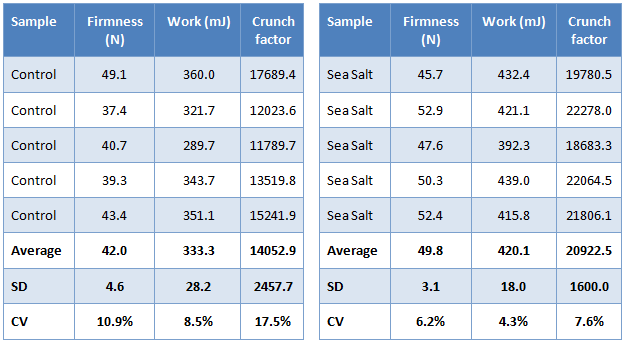
- Crunch factor = firmness x work
- Average = arithmetic mean
- SD = standard deviation
- CV = coefficient of variation: (SD/Mean) x 100
Significance
It can be seen from the data that the signatures of the normal salt (control) product and the sea salt product are clearly distinguishable. The "crunch factor" is derived from measures of both firmness and work done to achieve the full cut, and a sharper peak in the graph shows a crisper snap. In fact over multiple samples, there is also greater consistency (CV) in the sea salt preparation than in the control sample.
By establishing data profiles in this way for the subjective assessment (bite) of quality-approved sample products, an objective comparator can be used in the texture analyzer for accurate and repeatable mechanized production line testing. New formulations can also be tested that improve consistency or shelf life, based on expert sensory assessment but objectively measurable.