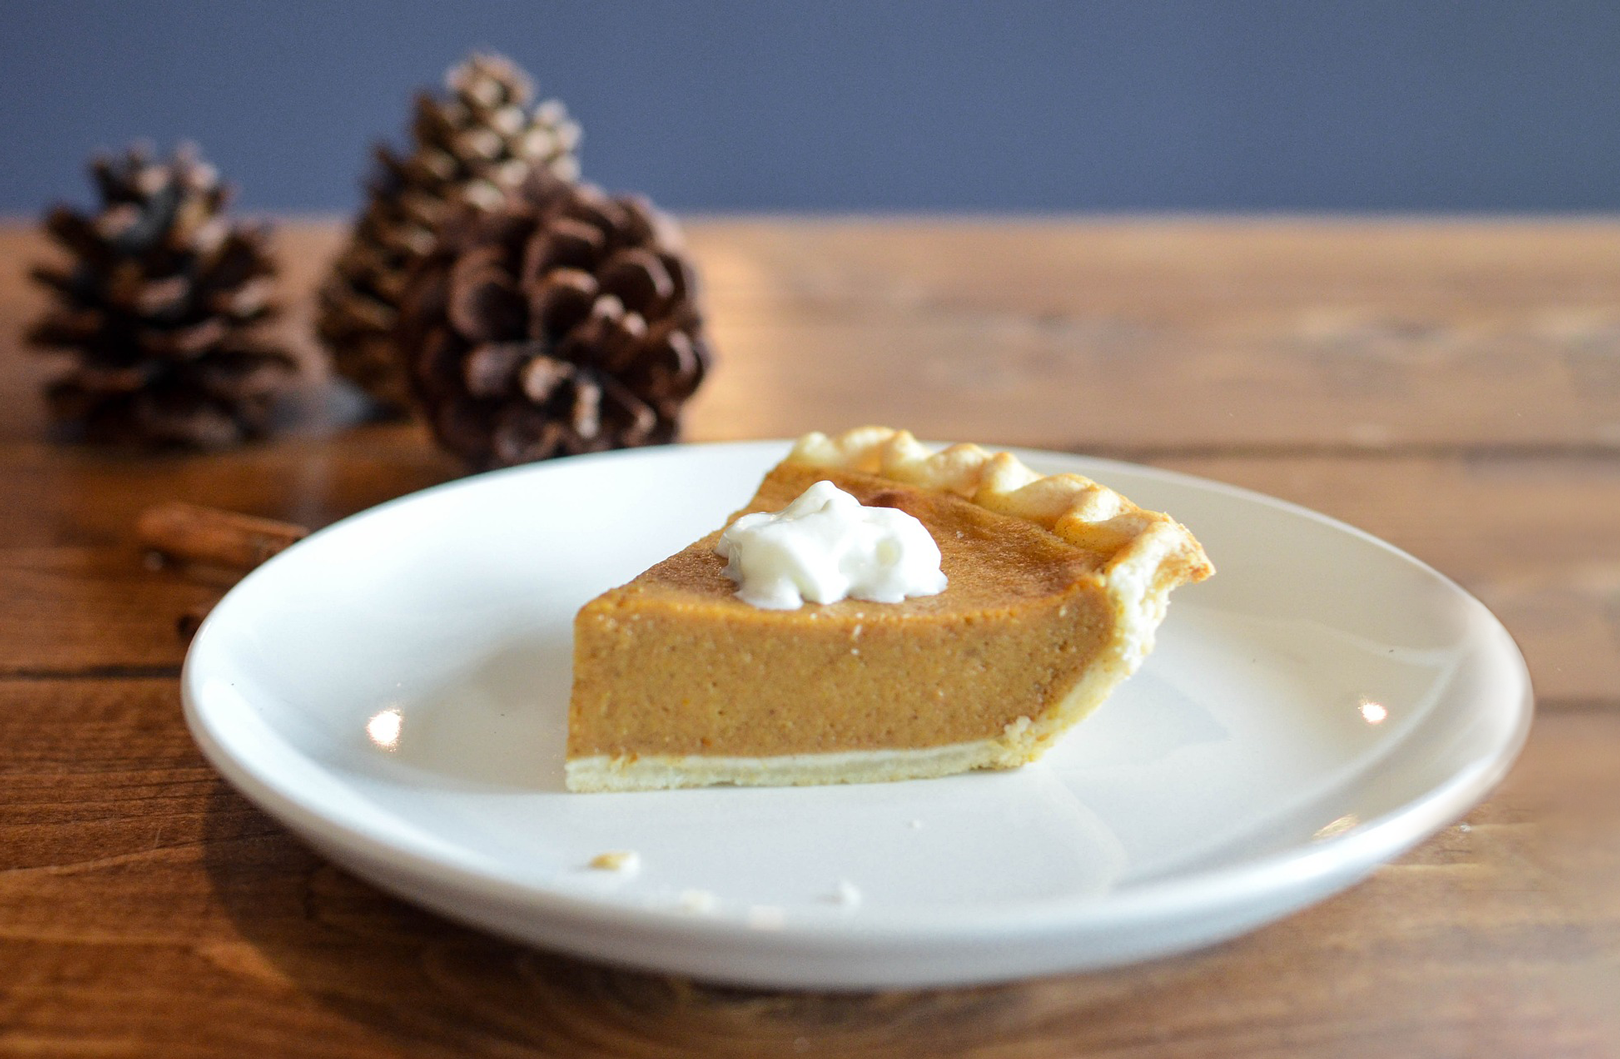
Texture Analysis SolutionsPumpkin (processed) filling firmness and consistency
Highlights
- Objective formulation profiling of alternative sugar-content products prior to packaging
- Repeatable and accurate comparison test method using a software-controlled texture analyzer
- Industry-standard extrusion fixture to evaluate the influence of processing parameters on flow and consistency
- Quantified firmness texture proving sensory variation can be clearly indicated
Situation
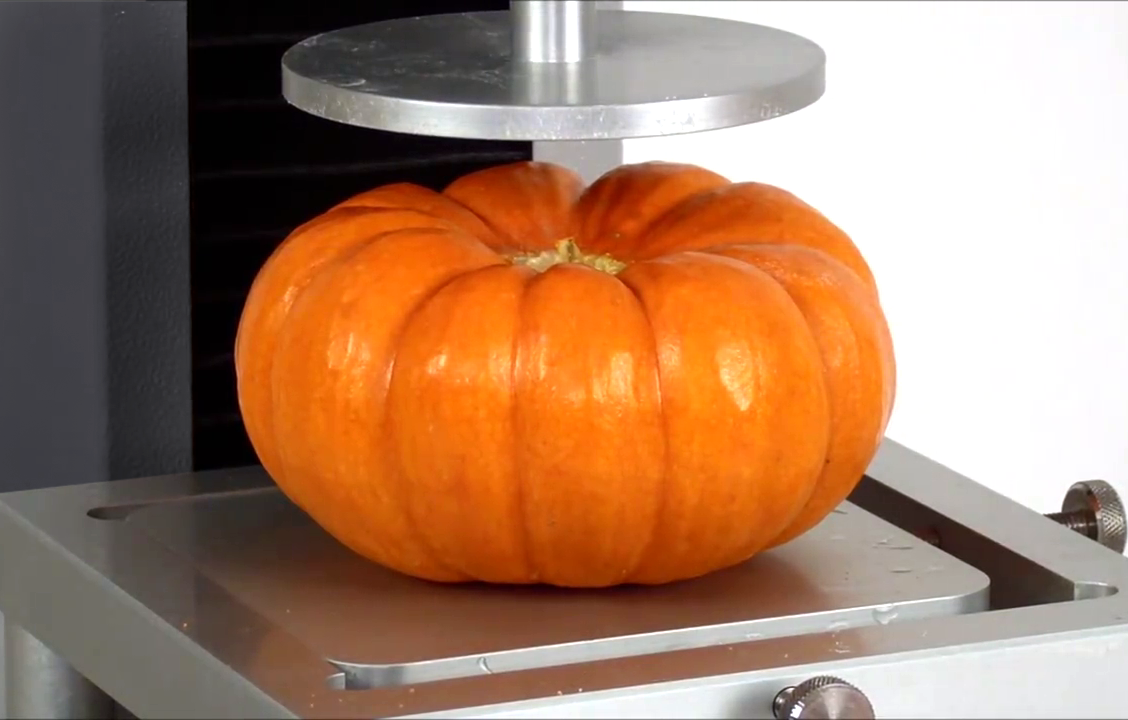
 Processed pumpkin filling is typically sold as a processed, canned product. For this particular method, the processor was interested in having more complete understanding as to how certain variables in the formulation can affect the final product. These variations could include various differences in incoming supplied raw product, ingredient changes, storage conditions and different cooking parameters. For this particular case study, samples with different sugar levels were used as a comparison. The ultimate goal of this study is to develop a method in which the quality of the final customer product could be quantified in a repeatable and objective manner.
Method
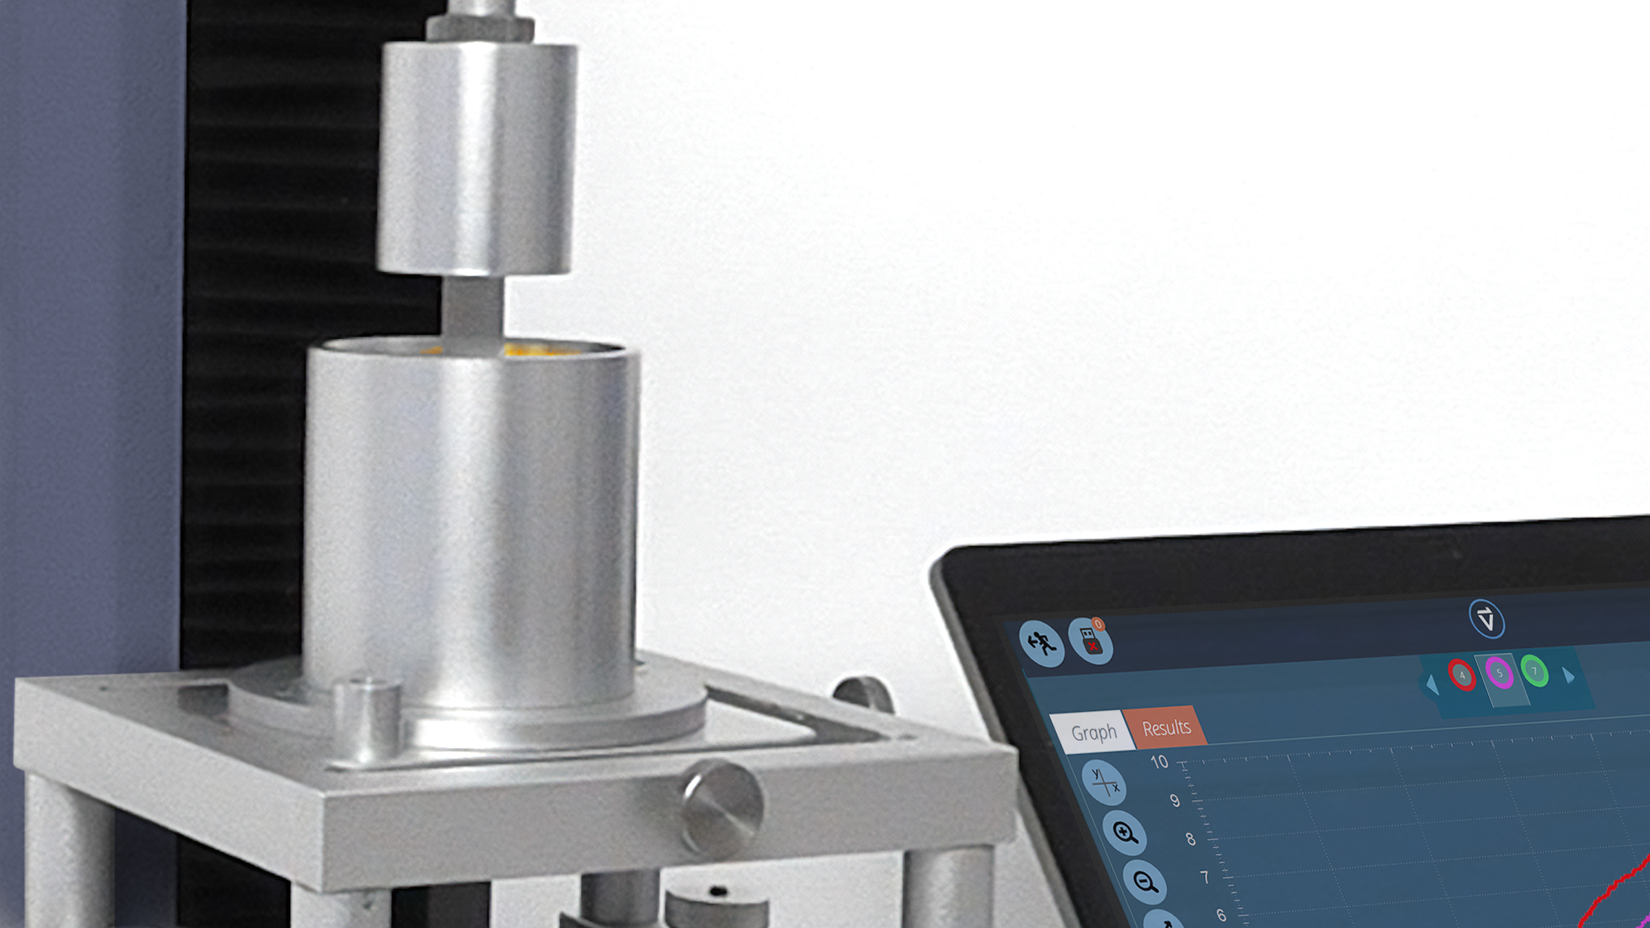
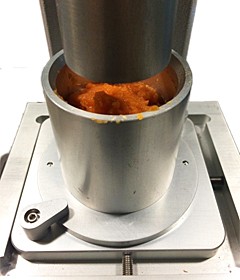
For this test, the TMS-Pro Texture Analyzer was used, now replaced by the OmniTest Texture Analyzer. It was fitted with a 500N Intelligent Load Cell and the Dual Extrusion Cell was selected as the optimum fixture to evaluate the desired textural qualities. The design of this cell allows a firmness value to be calculated in regards to the product’s resistance to flow, or movement by forcing the sample to be extruded. Each replication used approximately 50 grams of product in the sample container that had first been allowed to equilibrate to ambient temperature. Once placed on the texture analyzer, the plunger moves down into the sample at a speed of 250 mm/min. This prodedure was setup as a back extrusion test, in which the product flows around the plunger andback up toward the opening at the top of the sample cup. At the conclusion of the test, the TL-Pro software is used to calculate the peak force that occurs during the test. This force directly correlate with the firmness of the product. A higher force is representative of a product that is said to be of a firmer consistency and more resistant to flow.
Results
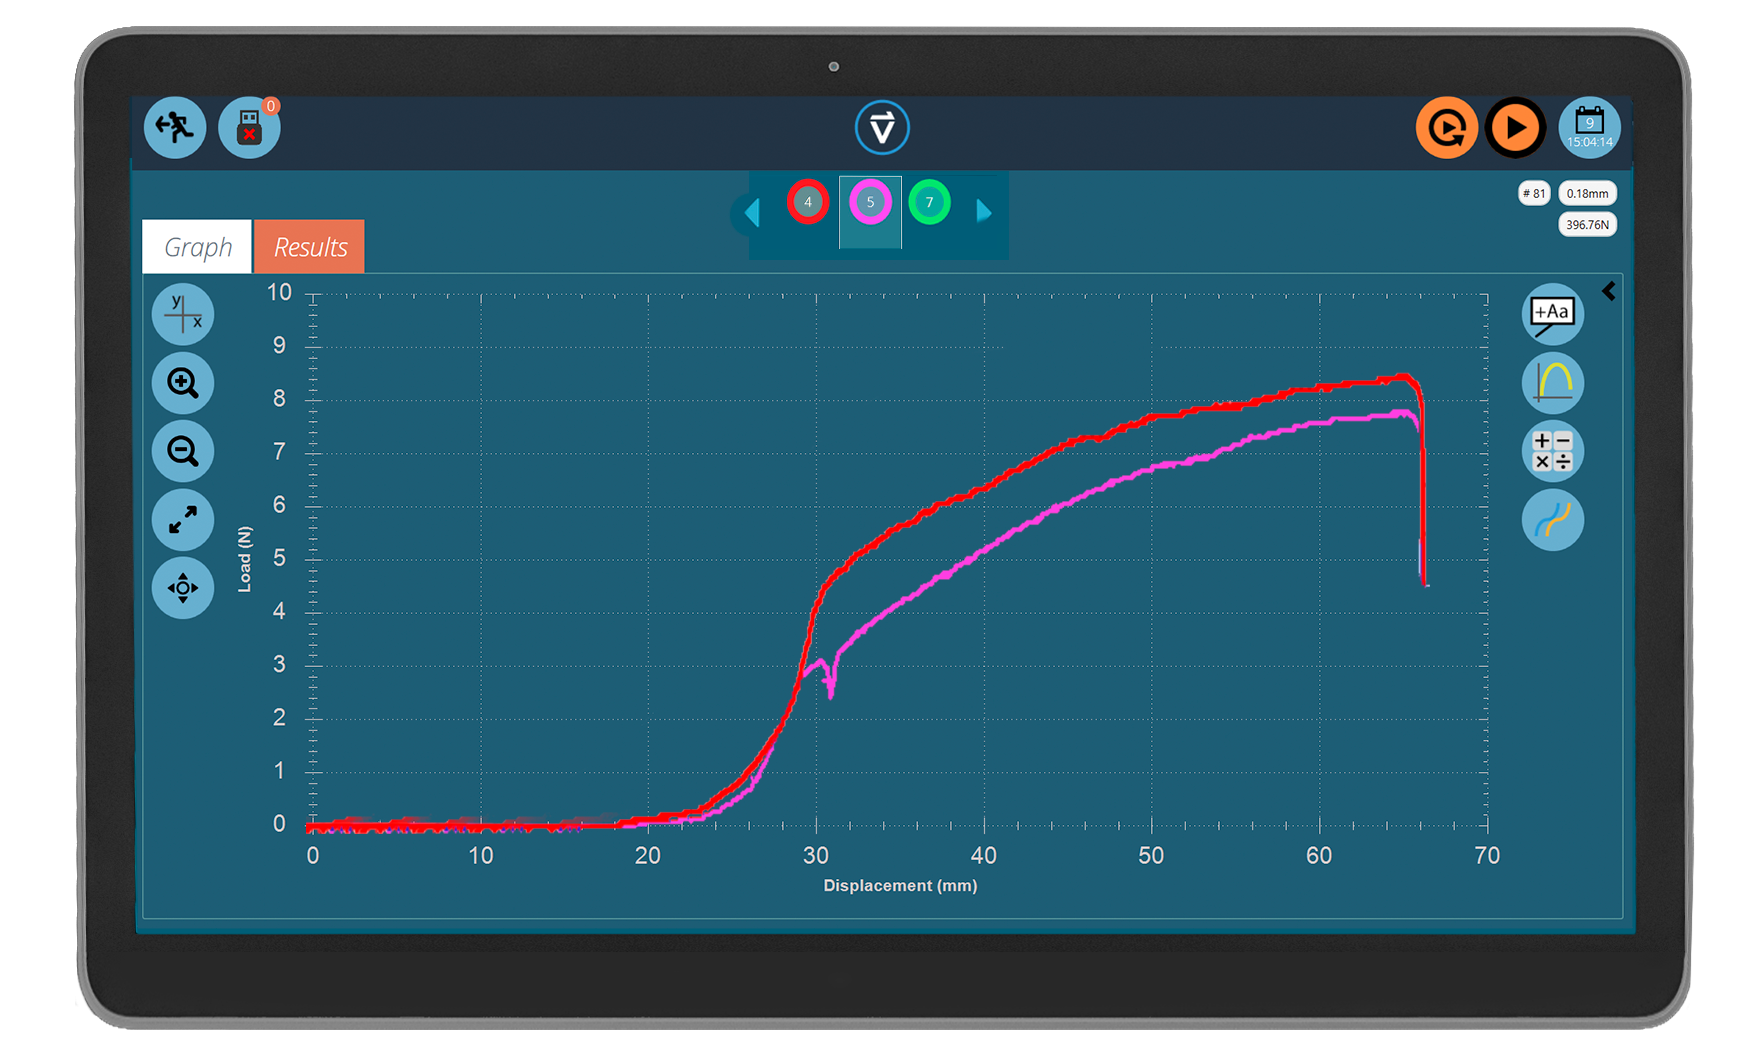
The graphical representation from TL-Pro (force applied, against cumulative displacement), of the test results for the pumpkin samples, is shown here.
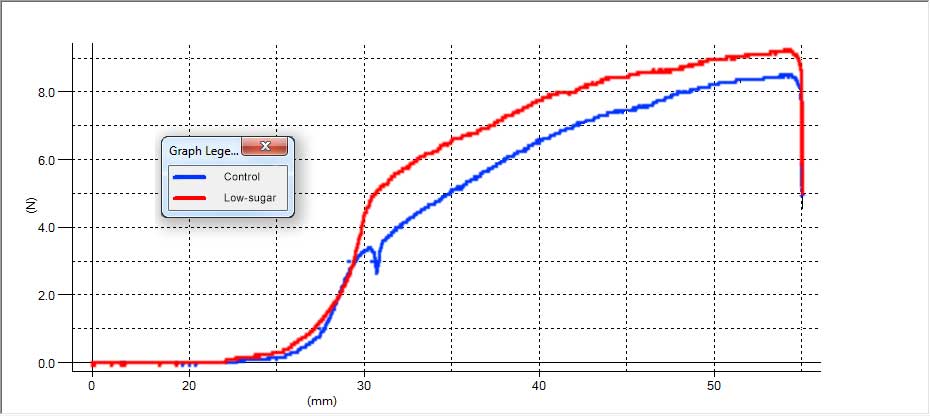
The two traces on the graph are representative of the two sample groups that were tested—low-sugar formulation and standard (“control”). Graphically, this shows that the low-sugar sample requires more force to be compressed. Based on conversations with the manufacturer, this seems to support their observations as the low-sugar product is said to be more firm and be more resistant to movement, the texture analyzer results enabling a quantifiable way to monitor and control this variation.
The same results with additional calculations are shown here:
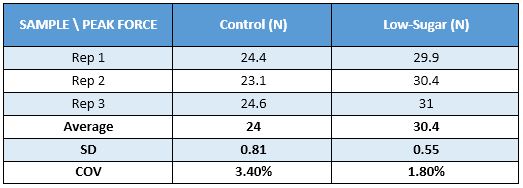
Average = arithmetic mean
SD = standard deviation
CV = coefficient of variation (SD/Mean) x 100
Significance
Using this method the processor would have an objective test to supplement their traditional sensory methods, which is subjective in nature. While the two products are similar, there is a clear separation of the two sample groups. The low-sugar sample consistently required more force to complete the test, meaning that this was a firmer product that was more resistant to flow.
Based on the observations above, it can be determined that the sugar substitute that is used in the low-sugar product increases the firmness of the product. The processor can use this method to not only understand how changes in sugar affect the final product, but how any number of variables in the formulation and process can play a role. Once this data is correlated to the historical sensory data, they will have objective information from instrumentation to validate the findings from sensory. Additionally the processor can maintain desired textural behavior should formulations need to change, for example if sugar concentrations are required to be reviewed.