Rice White and Brown Rice Firmness
Highlights
- Objective comparative test to evaluate the difference between white and brown rice mouthfeel
- Repeatable, reproducible and quick test method using a software-controlled texture analyzer
- Industry-standard Kramer fixture to compress and shear through a bulk sample to replicate an initial chew action
- Quantified hardness texture attribute correlated to firmness and softness as a function of rice grain variety
Situation
 For most consumers, the option of white or brown rice comes down to a preference in texture versus a desire for the healthy option. The two varieties are very similar– white rice is produced from brown by the removal of the outer bran and germ layers – however, producers aim to increase the similarity in terms of mouthfeel by further processing techniques on the white variety.
Is there an objective method to measure the firmness of brown rice and white rice to ensure consistency and save time over a subjective sensory study? Here we demonstrate a method that enables correlation with the subjective sensory data by testing each variety of rice with a food texture analyzer.
Method
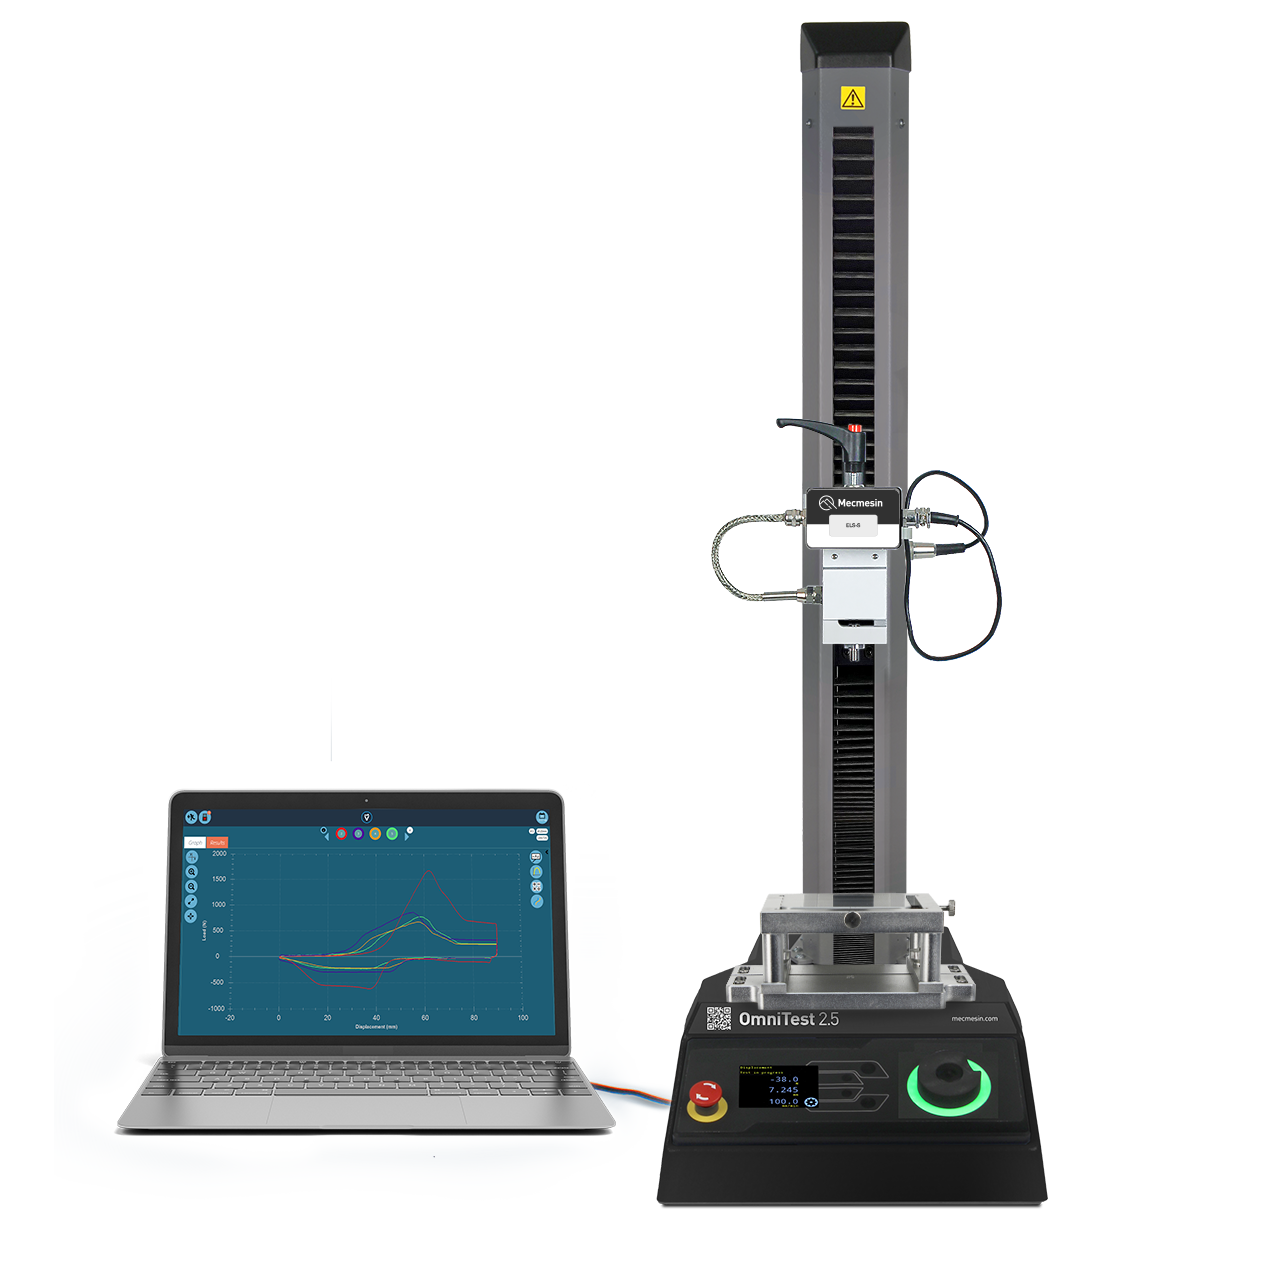
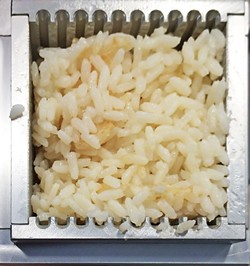 The test utilized a Food Technology Corporation (FTC) TMS-Pro Texture Analyzer fitted with a 2.5 kN intelligent loadcell and a CS-1 Kramer shear compression cell. This type of test cell most faithfully replicates the way a food item is actually consumed, in addition to allowing the testing of products in bulk form— producing more consistent results through averaging the texture across the whole sample.
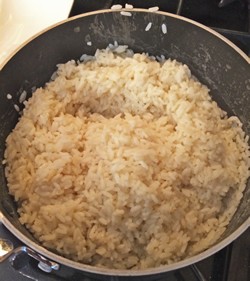
The rice was cooked in accordance with the supplier’s instructions and immediately placed in the Kramer shear cell to capacity. The FTC TL-Pro control and analysis software program moved the blades of the test cell down at a speed of 250 mm/min to a distance far enough to ensure that the product was completely expressed through the bottom. On completion of each test cycle, the software automatically calculated the peak compression force or ‘firmness’ of the sample.
Results
The graphical representation from TL-Pro, of the test results for the six samples, is shown here (force applied, against cumulative displacement).
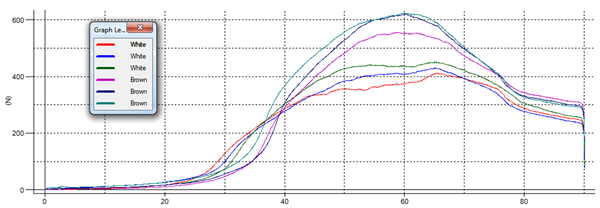
The two types of rice samples cluster, with the peak firmness higher for the brown variant, somewhere around 50% more firm. The slope rises first with the white rice, indicating slightly greater initial firmness, but this characteristic is quickly overtaken by the curves for the brown rice. This is probably explained by the starchy stickiness of the white rice’s outer surface providing more initial resistance than the smoother husk of the brown.
The same results with additional calculations are shown here.
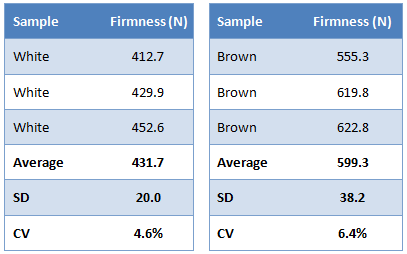
- Average = arithmetic mean
- SD = standard deviation
- CV = coefficient of variation(SD/Mean) x 100
Significance
Consistency in the results, with a low coefficient of variation, demonstrates that this method of testing is a reliable, accurate and repeatable way of objectively measuring the texture of rice. The clear clustering of the two variants correlates well with the historical subjective knowledge that brown rice feels firmer. Any slight variance in each sample group is most likely a consequence of cooking time and/or temperature variations – an effect that would be present when the consumer prepares the product. The fact that the results still clearly differentiate between white and brown varieties further emphasizes the value of using a texture analyzer in the quest to produce brown rice with the preferred firmness of white.
Dedicated Rice Texture Analyzer
The texture of rice is vital to how the consumer perceives the quality of the product.
The Mecmesin Rice Texture Analyzer is a bench-top, software-controlled instrument to measure the sensory mouthfeel of cooked rice and other foods. VectorPro software controls the Texture Analyzer to apply the forces on the test sample, acquires the data and automatically calculates the results which correlate to the correct sensory qualities. The food scientist can examine the graph of force vs displacement and assign peak, average, areas and other values to texture property calculations.
This system gives the rice producer a quantifiable method to benchmark and compare the texture of different rice varieties, optimize the cook profile (to indicate consumer preparation instructions) and check the consistency of supplied raw grains. It can evaluate the impact of variations in harvesting, which affects the protein and carbohydrate levels in rice. These two characteristics have a great deal of influence on the final texture when it is prepared.