Texture Analysis SolutionsDough Firmness and Stickiness
Highlights
- Objective measurement process developed to enable understanding the impact of manufacturing formulations on tactility
- Repeatable and accurate test method replicating processing elements using a software-controlled texture analyzer
- Precision compression plate to compress and allow recovery of the alternative moisture-content dough mixes
- Quantified hardness and springiness texture correlated to preferred levels of firmness and malleability
Situation
The firmness of baking dough products is strongly influenced by a number of factors, temperature being a major consideration, especially with frozen or chilled goods. Different dough-based bakery items contain a variety of additional ingredients in addition to the dough element in order to achieve the desired texture of the final baked product. Breads, biscuits, cookies, cakes, dumplings, flatbreads, etc. include flour and water essentially, but also may include yeast (or another leavening agent) plus potentially other liquids, fats or additives to improve taste, shelf-life, color and indeed texture. A processor needs to know the variance in their dough products for quality control and whilst sensory methods can go some way to evaluate variance, our customer wanted to move to more objective and quantifiable measurement. Using texture analysis in correlation with sensory allows the manufacturer to put objective values to their historical data, giving them a more complete understanding of the effect of these influencers on the firmness of the product.
Method
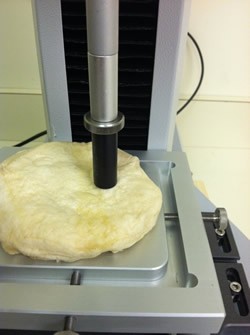
All testing used Food Technology Corporation’s (FTC) TMS-Pro Texture Analyzer fitted with a 250 N intelligent loadcell. The test accessory that was suitable ideally designed for our purposes was the 12.7 mm diameter lightweight precision cylinder probe and the samples were tested on the standard fixture table. This was in order to replicate the current evaluation technique which allows for some flow and freedom of movement in the dough once ready for preparation by any recipe-specific shaping, spreading, kneading and baking. Two batches of were supplied, labeled ‘Batch A’ and ‘Batch B’ and after being allowed to equilibrate to ambient temperature, 72°F (22°C), the product was ready for testing. For each replication a measured quantity and similarly shaped patty of dough was tested. The software program moved the probe down until detection of the top of the dough sample, zeroed the load and displacement, and then ran down into the product at 200 mm/min to 5 mm before returning to the zeroed position. The TL-Pro software analyzed the data and calculated the peak force (firmness) attained in three samples from each batch product.
Results
The graphical representation from TL-Pro, of the test results for the 6 samples, is shown here (force applied, against cumulative displacement).
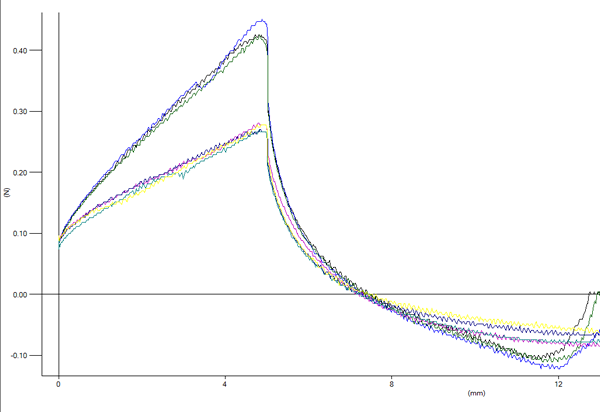
The two sample groups are clearly distinguishable and within each, the curves are very consistent. Distinct separation between sample sets is an ideal result when measuring a difference caused by a variable. The peak force at the small compression displacement of 5 mm, is followed by sharper release and recovery of the product and finally some indication of the stickiness of the dough is recorded as the force moves into tension.
The same results with additional calculations are shown here.
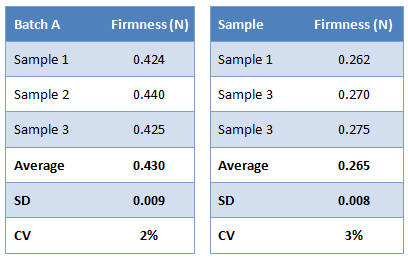
- Average = arithmetic mean
- SD = standard deviation
- CV = coefficient of variation(SD/Mean) x 100
Significance
These results, with clear clustering and CV values of less than 3%, clearly demonstrate how this test method can be used to objectively measure the effect of different processing parameters on a dough product’s firmness, recovery and stickiness. This repeatable procedure is suitable for quick and accurate evaluation of how the dough texture will be experienced when being laid out for manipulation prior to baking. Should specific texture assessment be required for other preparation techniques, the utilization of a different test cell and/or probe could easily be incorporated into this texture analyzer-based quality control process.