Texture Analysis SolutionsCocktail Sausage Firmness Comparison
Highlights
- Objective comparative measurement of physical mouthfeel properties sensed in biting reconstituted poultry and meat products
- Repeatable test method on batch samples of product using a software-controlled texture analyzer
- Industry-standard Kramer bulk analysis fixture to compress and shear as an indicator of overall tenderness
- Quantified hardness texture correlated to the ideal firmness and measured energy as an indicator of cohesiveness
Situation
 The following data was gathered for a potential client, in an effort to come up with a more consistent and objective way to evaluate the texture of their sausage products, specifically the firmness of the products. The current method is mostly on a sensory basis and can be very subjective. While sensory is important, it can vary significantly from person to person.
For this test Food Technology Corporation (FTC) was sent two sample sets, one beef and one chicken. FTC was asked to come up with a method that would be able to show a difference in the products that were sent.
Method
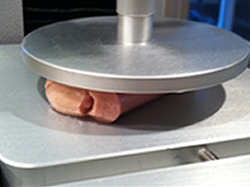
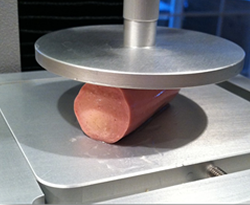
All testing was done with FTC’s TMS-Pro Texture Analyzer, fitted with a 25N Intelligent Load Cell (ILC). A 75mm compression plate was mounted to the ILC to apply the force to the individual samples. Each test replication involved the TMS-Pro compressing each sample to the same displacement of 20mm. The system moved down at a speed of 50mm/min until it came into contact with the sample. It then set the surface of the sample to zero mm displacement before compressing the sample to a displacement of 20mm. Having the system find the surface of the sample is an important step as there was some variation in the circumference of the samples. The displacement of 20mm was chosen as it was a distance that was far enough to cause the skin of the sausage to rupture. This motion is designed to replicate biting into a sample.
Results and Discussion
Below is the graphical representation of the samples that were tested. The X-axis is displacement and the Y-axis is force.
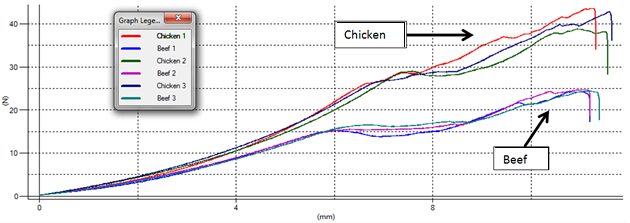
For this test, we looked at the maximum force that occurred and also the area under the curve (work) as both of these can be a good indicator of the overall cohesiveness and firmness of the product.
Below is a table showing the calculations that were done on the above graph.
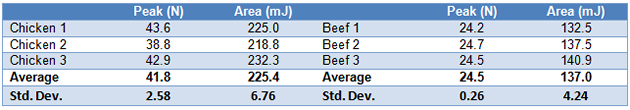
In looking at the results above, one can easily see the difference in the two sample sets. The chicken samples required almost double the amount of force to compress when compared to the beef samples. The beef samples were slightly more consistent than the chicken samples though we cannot say if this is the natural variation of the product as we had a limited number of samples to work with.
Significance
Based on our results, a significant and repeatable difference in the two products can be produced using the described methodology. In looking at the final data, one can conclude that the chicken product takes more energy and force to bite/chew than the beef products. This data is supported by the historical sensory data of the products.